
Site operators
Review incoming readings, device status and configured alerts. Use historical records when investigating changes or planning maintenance.
Bring environmental measurements, device status and configured alerts into one operating view. The Envitus IoT Platform connects monitoring sites with the people and systems that use their data, through dashboards, device management and defined interfaces.
Use shared monitoring alongside project-specific edge analytics, on-device AI and local autonomy. Define the device tasks and platform responsibilities for your deployment.
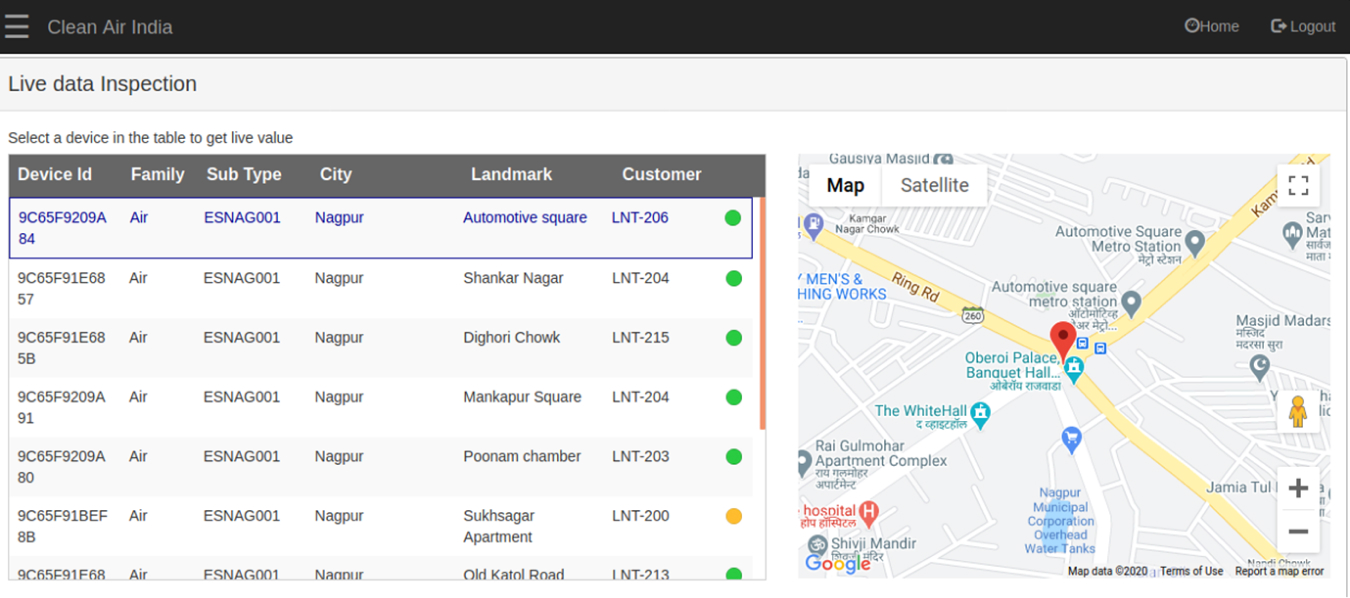
Dashboard demonstration with device locations, parameter readings and an air quality index display. Measurement and index methods are defined for the deployment.
Identify the locations, records and management functions each user group needs.
Review incoming readings, device status and configured alerts. Use historical records when investigating changes or planning maintenance.
Organize locations and user access around operational responsibilities. Use tenant and role configurations for distinct organizations or client groups.
Exchange monitoring data with compatible dashboards, command centers and operating systems. Agree interfaces and the data workflow for each integration.
Share selected environmental readings through enabled web or mobile views. Define which information and notifications are appropriate for the community deployment.
Configure the platform around connected devices, users and the operating workflow.
Bring selected measurements into maps, charts and dashboards. Review current records and changes over time using the reporting configuration for each site.
Configure alert conditions, recipients and enabled channels. Define how operators review readings and respond to the conditions being monitored.
Onboard compatible devices and review their status. Use the diagnostic information available from each device to investigate operating issues.
Configure tenant access and user roles. Scope single sign-on integration around the identity system and management responsibilities.
Connect monitoring records with compatible third-party applications through agreed APIs. Define data fields, authentication and integration requirements.
Use over-the-air updates for supported devices. Confirm the update procedure, authorized users and recovery arrangements for each configuration.
Envitus devices and compatible third-party equipment connect through defined interfaces. Review the data structure and operating requirements before agreeing an integration.
The monitoring architecture defines where measurements, processing and decisions take place.
Collect the selected measurements and device information. Define reporting intervals, communications and any local data storage for each configuration.
Scope edge analytics, on-device AI and local autonomy for the required local task. Confirm hardware, firmware, inputs and permitted actions.
Give teams access to measurements, historical views, alerts and device management. Define user permissions and the operating responsibilities for the platform.
Exchange agreed data with third-party applications. Identify the system that owns each workflow and confirm interface behavior during interruptions and recovery.
Specify who can view records, change settings, manage devices and administer users. Agree tenant separation, identity integration, data retention and hosting responsibilities for the deployment.
Confirm the diagnostic information available from each device and the steps used to investigate a problem. For supported firmware updates, define authorization, update verification, maintenance windows and recovery procedures.
Review device access, authentication, data protection, backup arrangements and support responsibilities against your organization's requirements. Confirm the implemented controls and procedures as part of the deployment review.
Planning reference: NIST's IoT cybersecurity capabilities catalog.
The Citizen App provides access to environmental data from monitored locations. Enabled views can include air quality and weather readings, with notification preferences for the deployment.
Define the data available to each audience, the index methods used and the notifications to publish. Confirm the current app functions and access arrangement for your project.
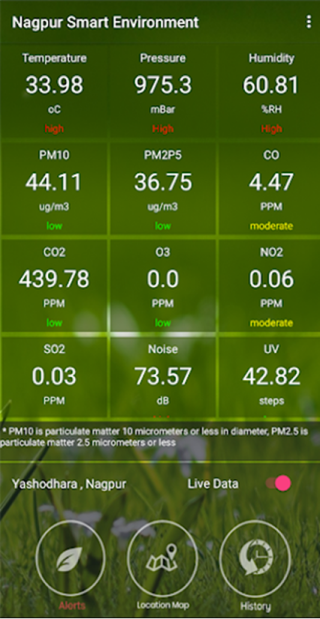
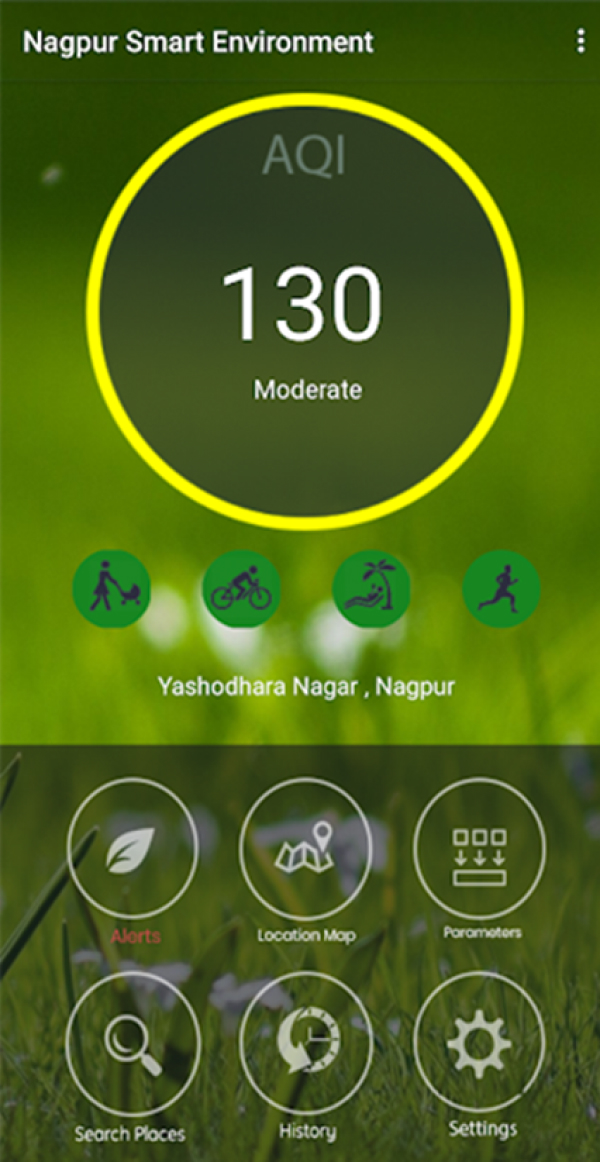
Interface examples. Measurements, index displays and app functions depend on the connected sensors and deployment.
Hosting options include AWS, Azure, Google Cloud Platform and private cloud infrastructure. Assess integration, data location, access, backup and operating requirements before selecting the architecture.
Agree responsibility for platform administration, updates and infrastructure operation, along with any availability and support requirements.
Share the devices, users and data workflow so the configuration and integration scope can be assessed.
List device types, interfaces, measurements, locations and reporting intervals. Include expected record volumes and any existing systems to integrate.
Specify the tasks that run at the device and those that require platform access. Include interruption behavior, data recovery and any local control requirements.
Identify user groups, roles, identity integration and data location requirements. Agree retention, backups and responsibility for access administration.
Define APIs, authentication, diagnostics and update procedures. Agree acceptance checks, maintenance arrangements and operating responsibilities.
The Envitus IoT Platform is the shared software layer for environmental measurements, dashboards, alerts, user access and device management. It connects site data with operators and agreed third-party interfaces.
Edge analytics, on-device AI and local autonomy are available through project-specific device configurations. Define the local task and operating limits separately from the shared dashboard, reporting and management functions.
Compatible devices and systems can be integrated through defined interfaces and APIs. Confirm protocols, device identifiers, data fields, units, timestamps and authentication. Integration scope and acceptance checks are agreed for the project.
Multi-tenancy supports separate organizations or client groups within a deployment. Configure tenant data, users and permissions around their responsibilities. Single sign-on integration can be scoped against the required identity system.
Hosting options include AWS, Azure, Google Cloud Platform and private cloud infrastructure. Assess the architecture against integration, data location, access, maintenance and operating requirements. The selected environment is defined for the deployment.
Define the measurements to retain, retention period, permitted users and any export or API needs. Confirm hosting location, backup arrangements and responsibilities for administering access before deployment.
These functions depend on device hardware, firmware and integration support. Confirm available diagnostics and the update procedure for each device type, including authorization, maintenance windows and recovery arrangements.
Local measurements, storage and decision logic depend on the device configuration. Remote dashboards, notifications and management operations have their own communication dependencies. Agree how missing readings are shown, which data can be recovered and how connected operation resumes.
Share your device types, users, data needs, hosting requirements and integration plans.